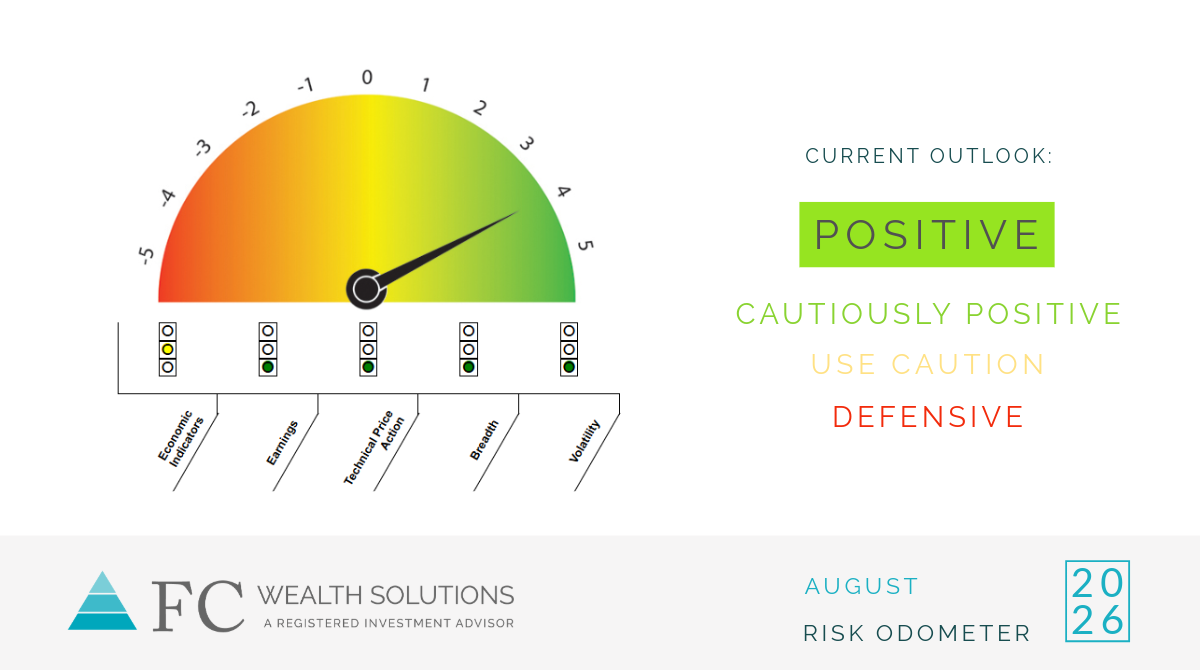
Our Risk Odometer improved from +3 to +4 this month, its first change since February. Our Current Outlook remains at its highest level of "Positive," a rating we have now maintained for over a year.
The improvement was driven by our Economic Indicators signal, which moved from -1 to a neutral 0. This indicator has been a lone holdout of weakness for much of the past two years, so seeing it turn is a meaningful development. While it has not yet turned outright positive, the shift to neutral removes a persistent drag on our net score and reflects improving conditions in the leading economic data we track.
Adding to the positive backdrop, second quarter earnings for the S&P 500 came in remarkably strong, growing over 50% year-over-year. Earnings are the single most important driver of long-term equity returns, and growth of this magnitude is difficult to ignore. This has fueled a wave of positive sentiment across the markets, with investors increasingly confident that corporate profitability can support current valuations, even as those valuations sit at elevated levels.
The markets are not absent risks. Concentration in a handful of widely held companies remains our biggest concern, as does sticky inflation and an uncertain path for monetary policy under new Fed Chairman Kevin Warsh. Massive AI capex spending continues to underpin the bullish case, and so long as it continues, we believe corrections will be treated as opportunities rather than warning signs. Should that spending slow, or should the extraordinary earnings growth we are seeing begin to fade, we would expect our Risk Odometer to reflect it.
As always, we continue to believe our Risk Odometer provides guidance in making better investment decisions because it keeps us objective and disciplined. We use this methodology and advise our clients to do the same. Emotions are our enemies in investing.
It is important to understand that our Risk Odometer is not designed to anticipate small to medium corrections, typically those in the 5-15% range. Instead, it monitors for conditions which have typically preceded larger corrections. We believe trying to anticipate small to medium corrections sounds attractive but more often results in lost opportunity than savings.
The Equity Market Risk Odometer is our guide for judging risk in the equity market. It is used as a guide for investment decisions in our proprietary investment strategies. It is composed of various indicators based on leading economic indicators, earnings, technical price action, breadth, and volatility. Its score can range from +5 to -5. Readings greater than one are positive and readings less than or equal to zero are negative.