
2025 | July Risk Odometer
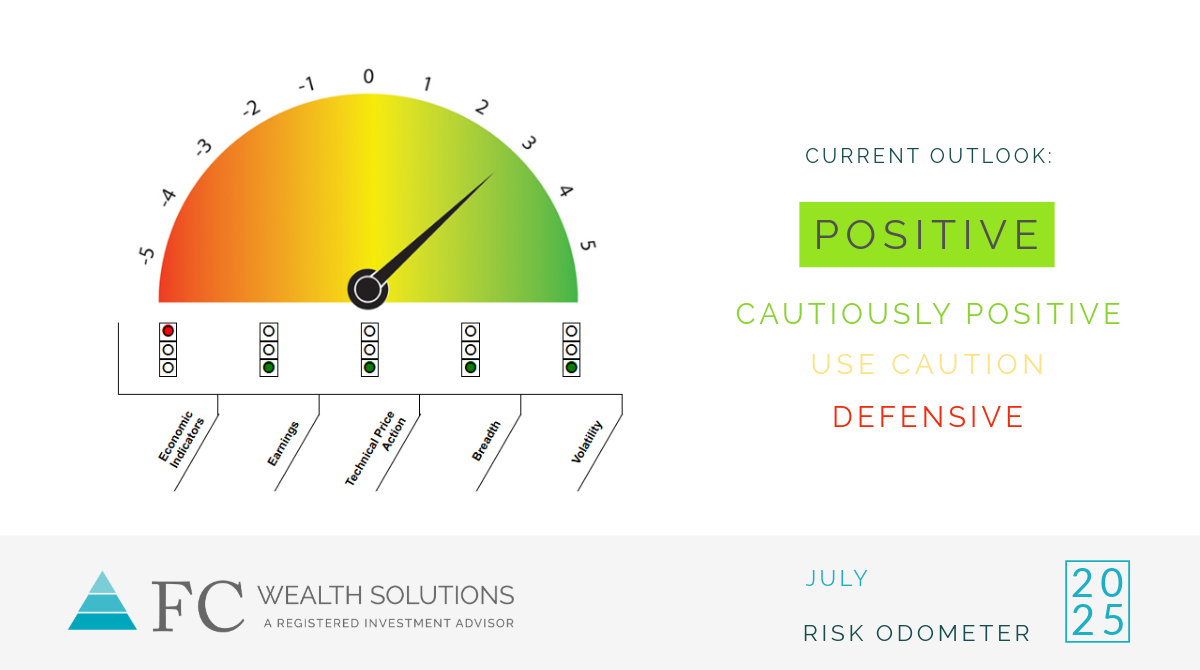
For the second consecutive month our Risk Odometer moved higher, from +1 to +3 this month. We also upgraded our Current Outlook to its highest reading of “Positive.” Our Outlook is now back to where it was in March prior the beginning of the tariff saga that started on Liberation Day in April.
The round trip our Risk Odometer took over the last four months was a direct effect of the tariffs. Although tariffs are not an input to the Risk Odometer, and little tariffs have been implemented thus far, the threat of them caused enormous market dislocations which impacted the data points we monitor. Thankfully, cooler heads prevailed, and the markets are in a much better place than they were a few months ago.
The tariff saga is not close to being over. Negotiations between the US and most of our trading partners are still ongoing and will likely continue for quite some time. What has been removed, though, is the fear that Trump will push our economy over a cliff for his tariff idealogue. The removal of this worst-case scenario, which took time to manifest, is what has allowed the markets to recover and the data we monitor to improve.
Market participants are now much more understanding of Trump’s negotiation tactics, which begin with asking for everything at the onset but later settling on something less. This understanding has kept new tariff threats from having material impacts on the markets and has allowed the markets to move to new highs. We always felt the tariffs threats were negotiation tactics, but markets often sell first and ask questions later.
While final tariffs rates remain uncertain, the passage of the One Big Beautiful Bill is a certainty and positive for the markets. The bill makes the 2017 temporary tax reductions permanent. It also increased the debt ceiling which should dramatically reduce the threat of government shutdowns for the next few years. These were all positive developments and improved our outlook.
During the bill debates, there was continual focus on the national debt, which most believe has become unsustainable. As a result of these debates, the plan of the current administration to tackle the debt problem became clear. Their plan is to reduce the growth rate of spending to levels less than the rate of economic growth. This should slowly reduce the debt over time to more acceptable levels, so long as economic growth continues to grow faster than spending. The key to that plan is that growth cannot falter. This is a major reason the administration is so focused on economic growth through deregulation and lower interest rates. Economic growth can be very volatile but spending growth is not. If economic growth falls and spending growth does not, the debt levels will become a bigger problem. We will continue to monitor our Risk Odometer to detect for warnings in this plan.
For now, though, things predominantly appear positive. Market breadth has improved with the removal of a self-inflicted recession, confirming the strength of the recent rally. Things can change quickly though as we witnessed earlier this year. We will continue to monitor changes in our Risk Odometer as early warning signs.
As always, we continue to believe our Risk Odometer provides guidance in making better investment decisions because it keeps us objective and disciplined. We use this methodology and advise our clients to do the same. Emotions are our enemies in investing.
It is important to understand that our Risk Odometer is not designed to anticipate small to medium corrections, typically those in the 5-15% range. Instead, it monitors for conditions which have typically preceded larger corrections. We believe trying to anticipate small to medium corrections sounds attractive but more often results in lost opportunity than savings.
___________________________________________________________________________________________________________________________________
The Equity Market Risk Odometer is our guide for judging risk in the equity market. It is used as a guide for investment decisions in our proprietary investment strategies. It is composed of various indicators based on leading economic indicators, earnings, technical price action, breadth, and volatility. Its score can range from +5 to -5. Readings greater than one are positive and readings less than or equal to zero are negative.
This information does not have regard to the specific investment objectives, financial situation and the needs of any specific person who may view this information. Statements, opinions, and forecasts made represent a particular observation and assessment of the market environment at a specific point in time and are not intended to be a forecast of future events or a guarantee of future results. Statements regarding future prospects may not be realized and may differ materially from actual events or results. Past performance is not indicative of future performance.
FC Wealth Solutions and its representatives do not provide legal or tax advice. You may want to consult a legal or tax advisor regarding any legal or tax information as it relates to your personal circumstances.
Michael Fickell is an investment advisor representative of FC Wealth Solutions
Securities and investment advisory services offered through FC Wealth Solutions, a registered investment advisor.
CRD#: 4209688